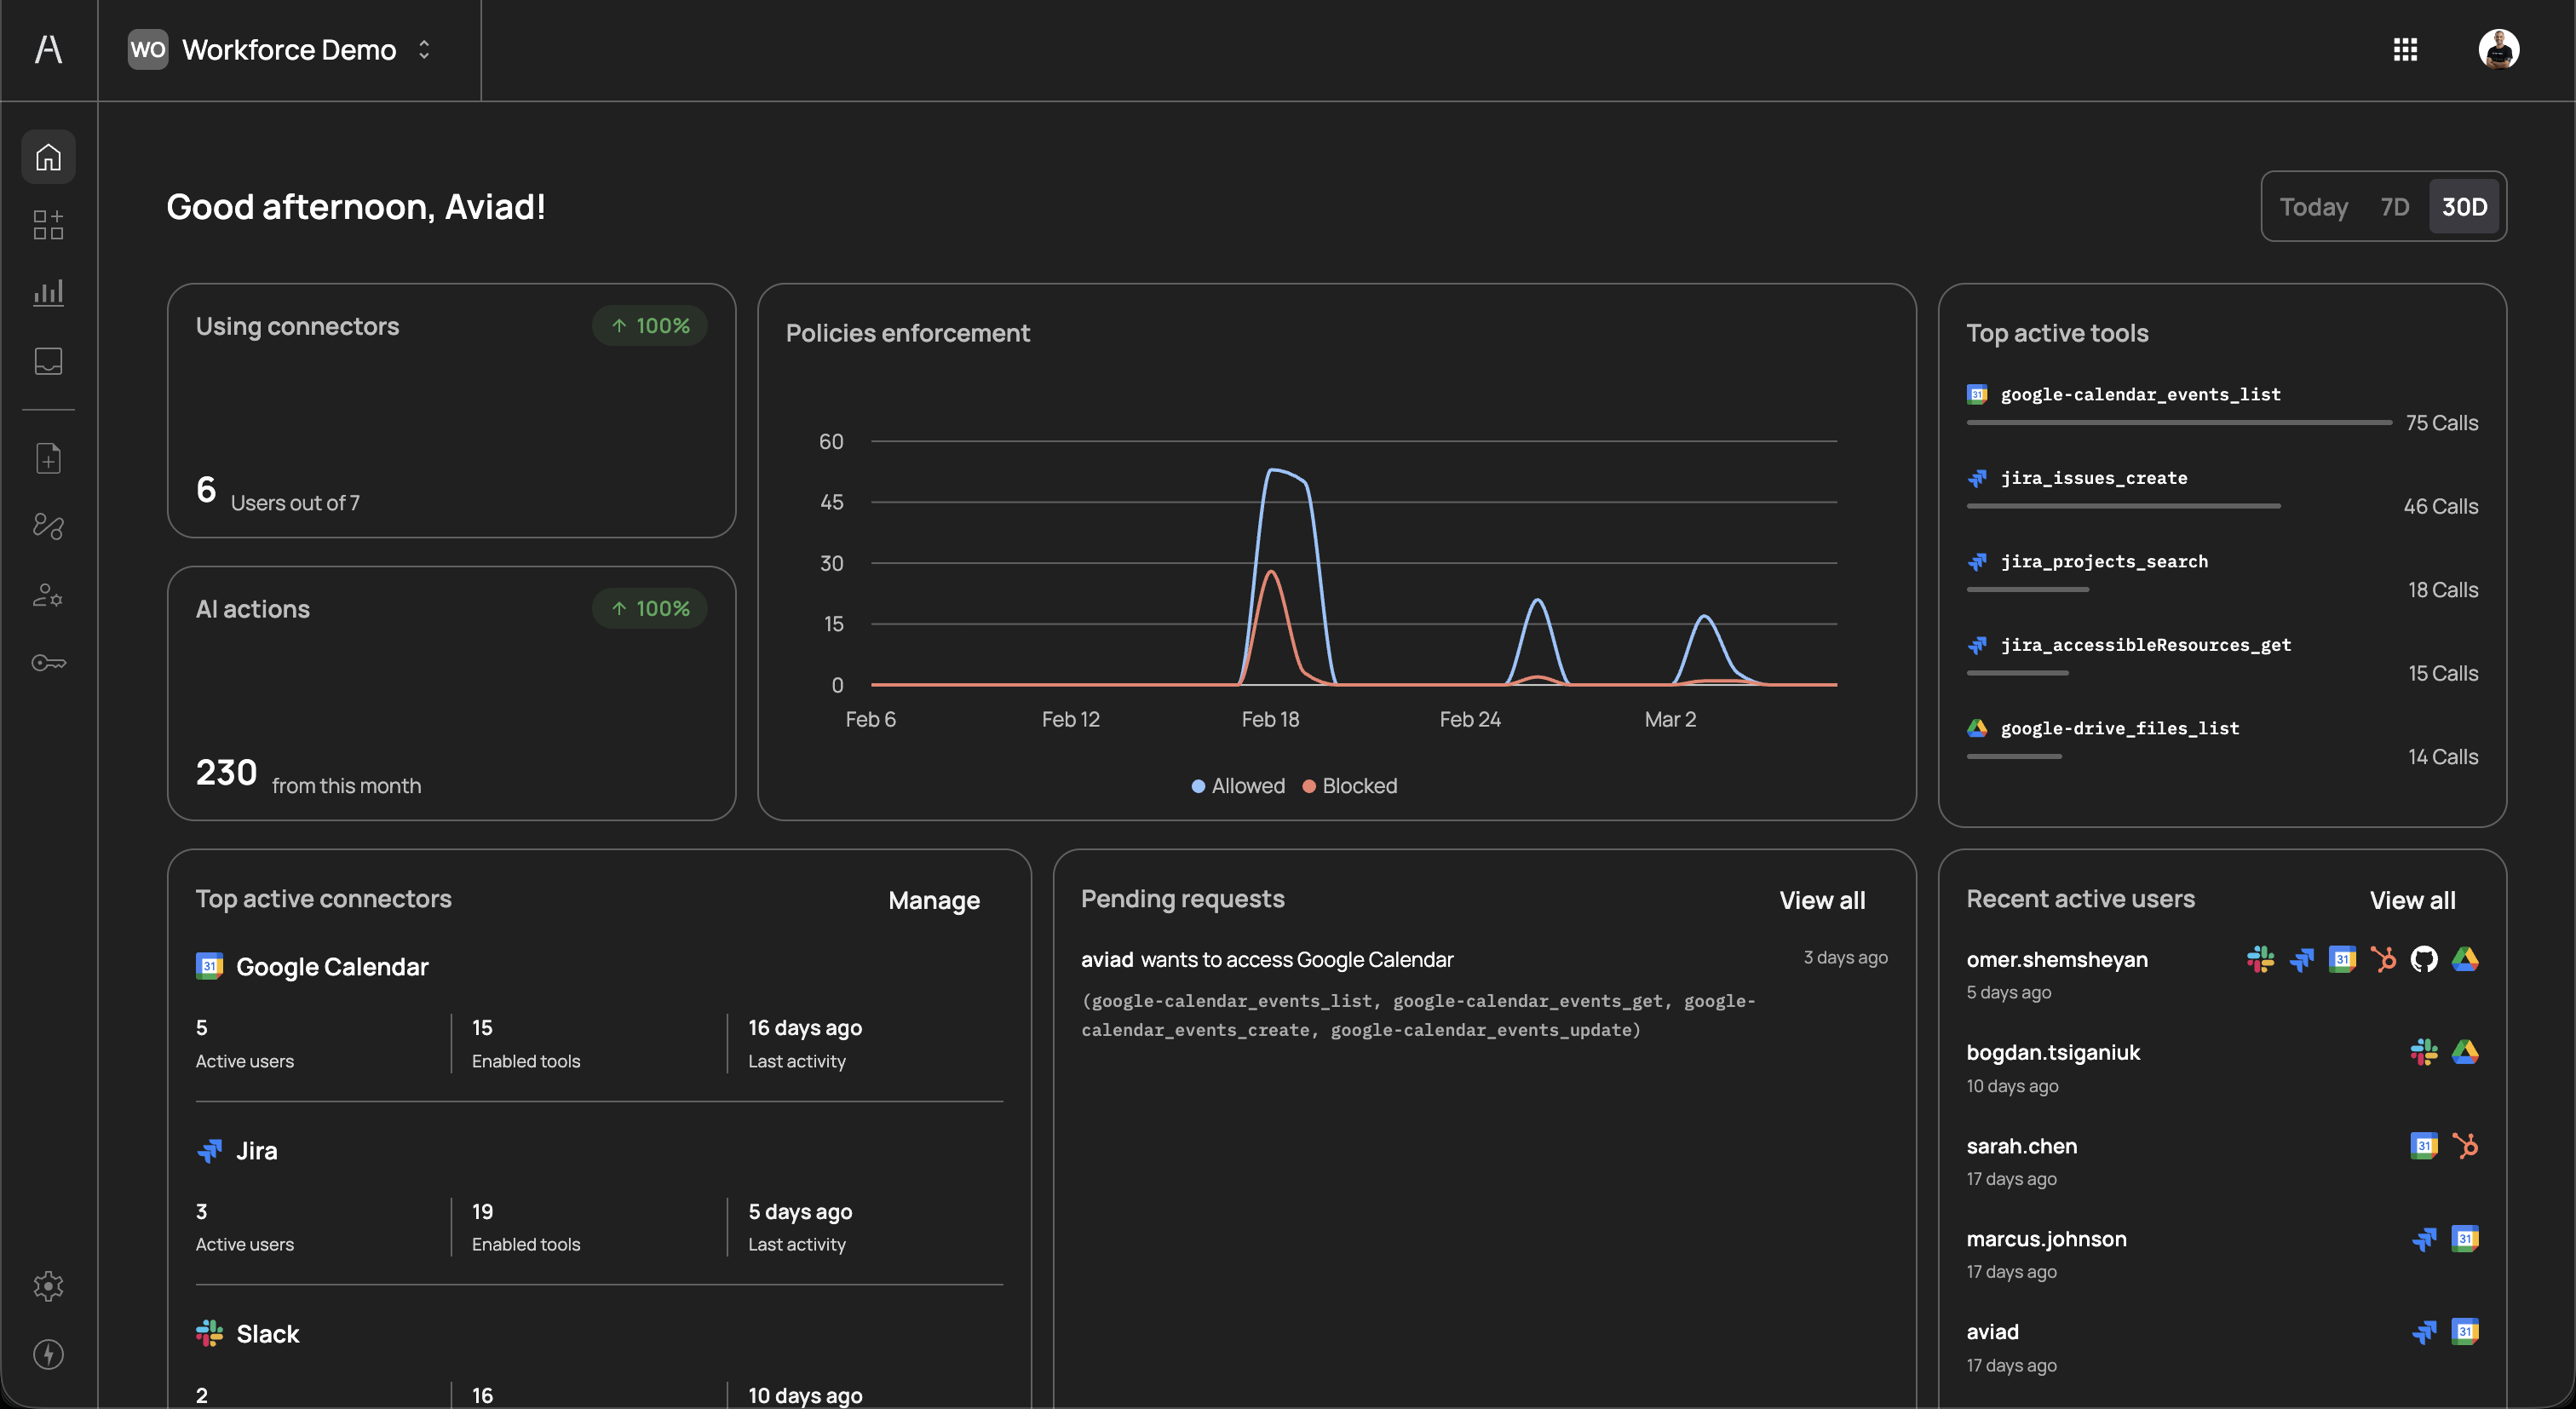
The Agen for Work dashboard is your central command center for monitoring and managing AI agent activity across your organization. It provides a real-time, at-a-glance view of connector usage, policy enforcement, tool activity, pending approval requests, and user engagement — all in a single screen.
The dashboard is the first page you see after completing the initial setup wizard. To access it at any time, click the Home icon in the left sidebar.
At the top-right corner of the dashboard, you can filter all dashboard data by time range. Three options are available:
| Option | Description |
|---|---|
| Today | Shows activity from the current day only |
| 7D | Shows activity from the last 7 days |
| 30D | Shows activity from the last 30 days |
Switching between time ranges updates all widgets on the dashboard simultaneously, allowing you to compare short-term trends against longer-term patterns. This is useful for identifying spikes in activity, tracking adoption over time, or investigating specific incidents.
The Using connectors card, located in the top-left area of the dashboard, provides a quick snapshot of connector adoption across your organization. It displays:
- Users out of total - The number of users who have actively used at least one connector during the selected time period, shown against the total number of provisioned users. For example, "6 Users out of 7" means six out of seven users in your organization have interacted with AI agents through connectors.
- Percentage change indicator - A percentage badge (e.g., "100%") showing the change in connector usage compared to the previous equivalent period. A green upward arrow indicates growth, while a red downward arrow indicates a decline.
This metric helps you understand how widely AI agent capabilities are being adopted within your workforce. Low adoption may indicate that users need additional onboarding or that the connected tools do not align with their daily workflows.
The AI actions card, positioned below the Using connectors card, tracks the total volume of actions that AI agents have performed on behalf of your users during the selected time period. It displays:
- Total action count - The aggregate number of tool calls made by AI agents. For example, "230 from this month" indicates that AI agents executed 230 individual tool actions within the current month.
- Percentage change indicator - A percentage badge showing how the action volume compares to the previous equivalent period.
Each action represents a single tool invocation by an AI agent — for example, listing Google Calendar events, creating a Jira issue, or searching Google Drive files. Monitoring this metric helps you gauge the overall productivity impact of your AI agent deployment and forecast capacity needs.
The Policies enforcement chart occupies the center of the dashboard and provides a time-series visualization of how your policies are being applied. The chart plots two data series over the selected time range:
- Allowed (blue line) - The number of AI agent actions that were permitted by your policies during each time interval
- Blocked (red line) - The number of AI agent actions that were denied, required step-up authentication, or were held for approval
The x-axis represents time (with date labels), and the y-axis represents the number of policy evaluations. Hovering over data points reveals the exact count for that interval.
This chart is critical for understanding whether your policies are appropriately balanced. Key patterns to watch for:
- High blocked-to-allowed ratio - May indicate overly restrictive policies that are hindering productivity. Consider reviewing which tools or actions are being blocked most frequently and whether those restrictions are still necessary.
- Sudden spikes in allowed actions - Could signal increased adoption or an unusual surge in AI agent activity that may warrant investigation.
- Steady red line at zero - Indicates that no actions are being blocked, which could mean either that your policies are well-tuned or that policies are too permissive and should be tightened.
The Top active tools panel, located on the right side of the dashboard, ranks the individual tools that AI agents use most frequently. Each entry displays:
- Tool name - The specific tool identifier, prefixed by the connector icon (e.g.,
google_calendar_events_list,jira_issues_create) - Call count - The total number of times the tool was invoked during the selected time period
- Visual bar - A relative bar chart showing the tool's usage compared to the most active tool
This ranking helps you identify which capabilities your workforce relies on most heavily. Common high-usage tools often include reading and listing operations (e.g., listing calendar events or searching for files), while write operations (e.g., creating issues or sending messages) typically appear lower in the ranking.
Use this panel to:
- Validate connector investments - Confirm that the connectors you have enabled are delivering value through active tool usage
- Identify automation opportunities - Frequently used tools may be candidates for further automation through approval flow optimizations or policy refinements
- Detect unusual patterns - An unexpected tool appearing at the top of the list may indicate misconfiguration or unintended AI agent behavior
The Top active connectors card, located in the bottom-left of the dashboard, provides a summary of your most-used connector integrations. Each connector entry includes:
| Column | Description |
|---|---|
| Connector name | The name and icon of the connected service (e.g., Google Calendar, Jira, Slack) |
| Active users | The number of distinct users whose AI agents have interacted with this connector during the selected period |
| Enabled tools | The total number of tools currently enabled for this connector |
| Last activity | The time elapsed since the most recent AI agent interaction with this connector |
A Manage link in the top-right corner of this card navigates directly to the Connectors page, where you can add, remove, or reconfigure connectors.
This card complements the Top active tools panel by providing a connector-level view rather than a tool-level view. If a connector shows a high number of enabled tools but low active users, it may indicate that the connector was recently added and users have not yet started using it, or that the connected tool is relevant to only a small team.
The Pending requests card displays approval requests that are awaiting review from an administrator or designated approver. When a policy with the Request approval action is triggered, the AI agent's action is paused and a request is created. Each pending request entry shows:
- Requester name - The user whose AI agent triggered the approval request
- Requested resource - The connector the user is requesting access to (e.g., "wants to access Google Calendar")
- Tools requested - The specific tools the AI agent attempted to use (e.g.,
google_calendar_events_list,google_calendar_events_get,google_calendar_events_create,google_calendar_events_update) - Time since request - How long ago the request was submitted
A View all link in the top-right corner navigates to the full Requests page where you can review, approve, or deny each request in detail.
Pending requests represent actions that are blocked until an approver takes action. Regularly reviewing this queue is important to avoid bottlenecks that could disrupt your users' AI-assisted workflows. Consider assigning multiple approvers or setting up notification integrations to ensure timely reviews.
The Recent active users panel, located in the bottom-right of the dashboard, lists the users who have most recently interacted with AI agents. Each entry displays:
- User name - The name of the user as synced from your identity provider
- Last active - How long ago the user's last AI agent interaction occurred (e.g., "5 days ago", "17 days ago")
- Connector icons - Small icons representing the connectors the user has interacted with, providing a quick visual summary of which tools each user engages with
A View all link in the top-right corner navigates to the full Users page for detailed user management.
This panel helps you understand individual usage patterns and identify:
- Power users - Users who interact with AI agents frequently and across multiple connectors
- Inactive users - Users who have not engaged with AI agents recently, which may indicate onboarding gaps or access issues
- Connector distribution - Whether users are concentrated on a few connectors or spread across many, which informs your connector and policy strategy
From the dashboard, you can navigate directly to manage any area of your Agen for Work deployment:
- Connectors - Add or configure the SaaS tools available to AI agents
- Policies - Create and manage access control policies
- User management - Manage user access and group assignments
- Approval flows - Define approver chains for sensitive operations