Grafana can be connected to Agen.co two ways, matching the Official / In-house filter in the connector picker:
- Official — Agen.co connects through Grafana Cloud's own hosted MCP server (
https://mcp.grafana.com/mcp), authenticated via OAuth 2.1, so your AI agents use the same dashboard, data source, alerting, and incident tools Grafana exposes to MCP clients like Claude Desktop and Cursor. - In-house — Agen.co wraps the Grafana REST API directly through its own integration layer, using a Grafana service account token you generate for your specific instance.
Pick Official if the built-in MCP tools cover what your agents need and your instance runs on Grafana Cloud. Fall back to In-house if you self-host Grafana, since the Official flow only supports Grafana Cloud.
Prerequisites
Prerequisites
- A Grafana Cloud account or organization
- In the Agen.co portal, go to Connectors → My connectors and click Add connector.
- In the search bar, type
Grafanaand select it from the results. - Optionally fill in Instance Slug — distinguishes multiple instances of this MCP connector by prefixing each imported tool as
slug__tool. Use lowercase kebab-case; leave empty for a single instance. This value is immutable after creation. - Click Connect.
- On the page that opens, enter your Grafana instance URL and click Continue.
Sign in and approve access. No service account token or other credentials need to be entered manually. Access is scoped to your Grafana RBAC permissions — the connected agent can only do what your Grafana user is allowed to do.
Once connected, Grafana appears under My connectors with tools spanning:
| Area | What it covers |
|---|---|
| Search & dashboards | Locating dashboards by title/metadata, retrieving dashboard details, and applying targeted patches |
| Data sources | Listing configured data sources and their details |
| Query engines | Prometheus (PromQL), Loki (LogQL), InfluxDB, ClickHouse, CloudWatch, Elasticsearch/OpenSearch, Snowflake, Graphite, and Athena |
| Alerting | Managing alert rules, routing policies, and contact points |
| Incidents & OnCall | Searching/creating/updating Grafana Incidents; managing OnCall schedules, shifts, teams, and alert groups |
| Sift | Retrieving investigations and detecting error patterns or slow requests |
| Annotations & rendering | Querying/creating dashboard annotations; exporting dashboards and panels as images |
| Navigation & admin | Generating deeplink URLs; managing teams, users, roles, and permissions |
Enabling the Grafana connector isn't enough on its own. Tool calls remain denied until you create a policy that grants access to the specific tools you want to expose.
Grafana is an open-source observability platform for visualizing metrics, logs, and traces. Integrating Grafana with Frontegg allows your application to access dashboards, data sources, alerts, and annotations on behalf of your users using a Grafana service account token.
Prerequisites
Prerequisites
- A Grafana Cloud account
- Admin access to your Grafana instance
Log in to your Grafana instance and click Administration in the left sidebar to expand the administration menu.
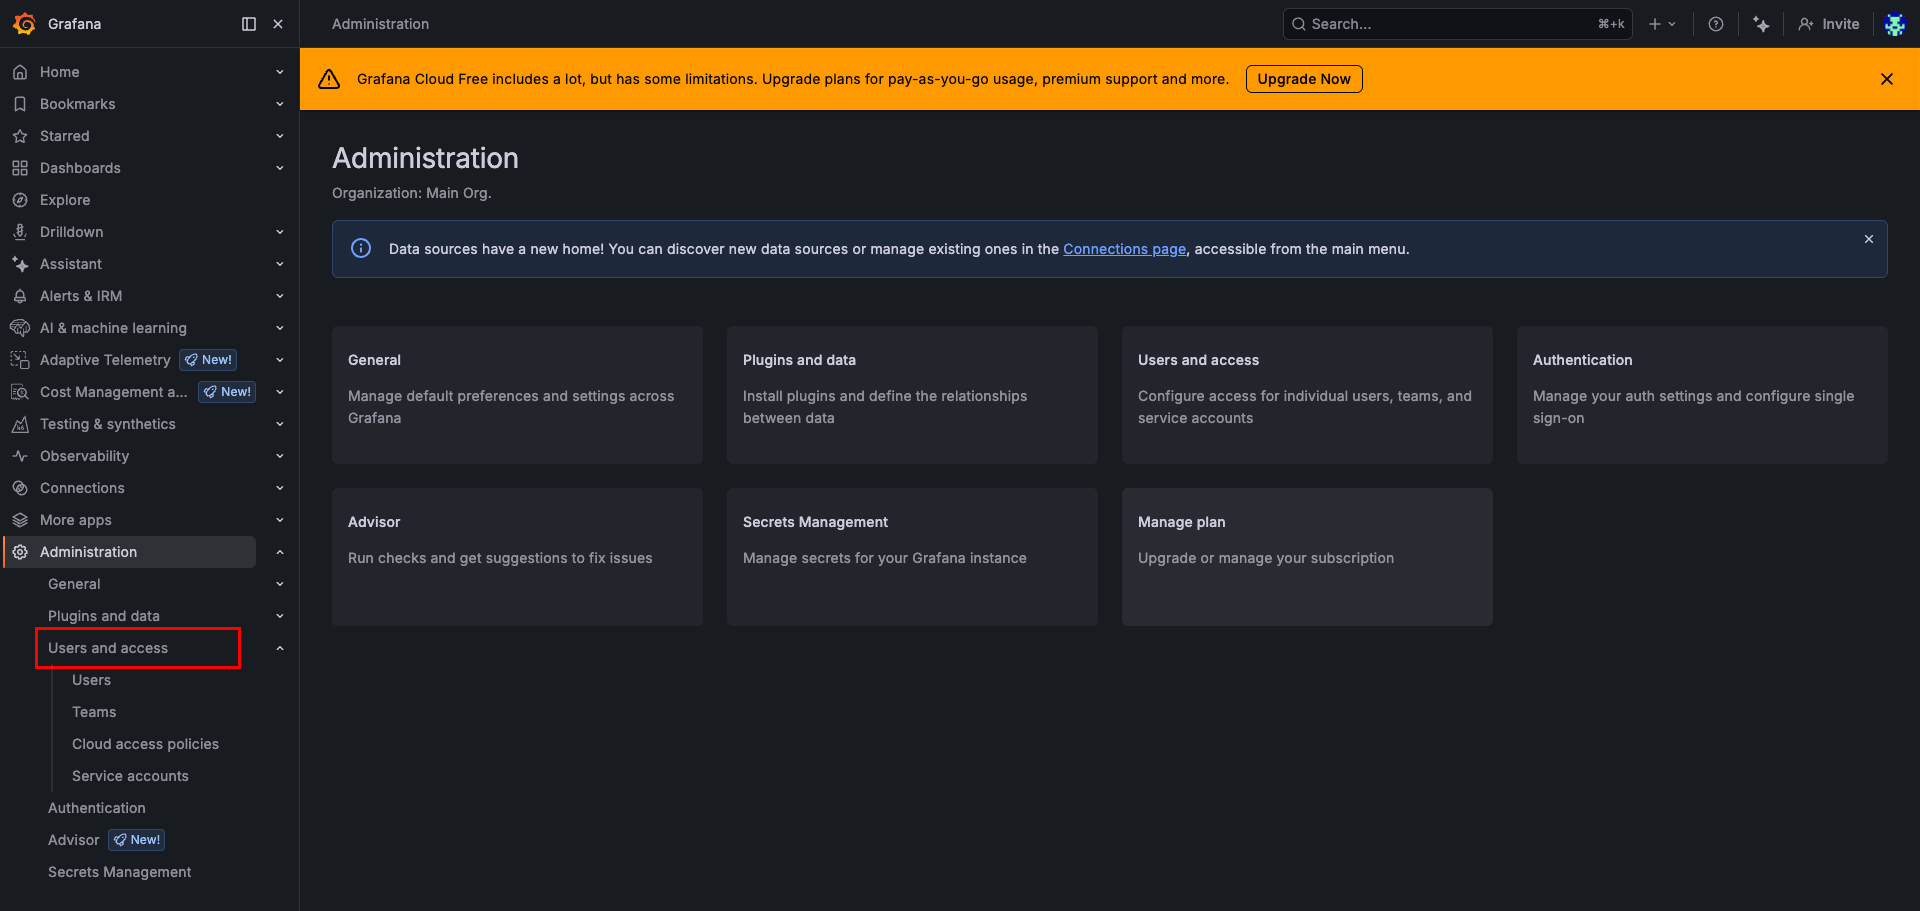
In the Administration menu, click Users and access, then click Service accounts. The Service accounts page lists all existing service accounts for your instance.
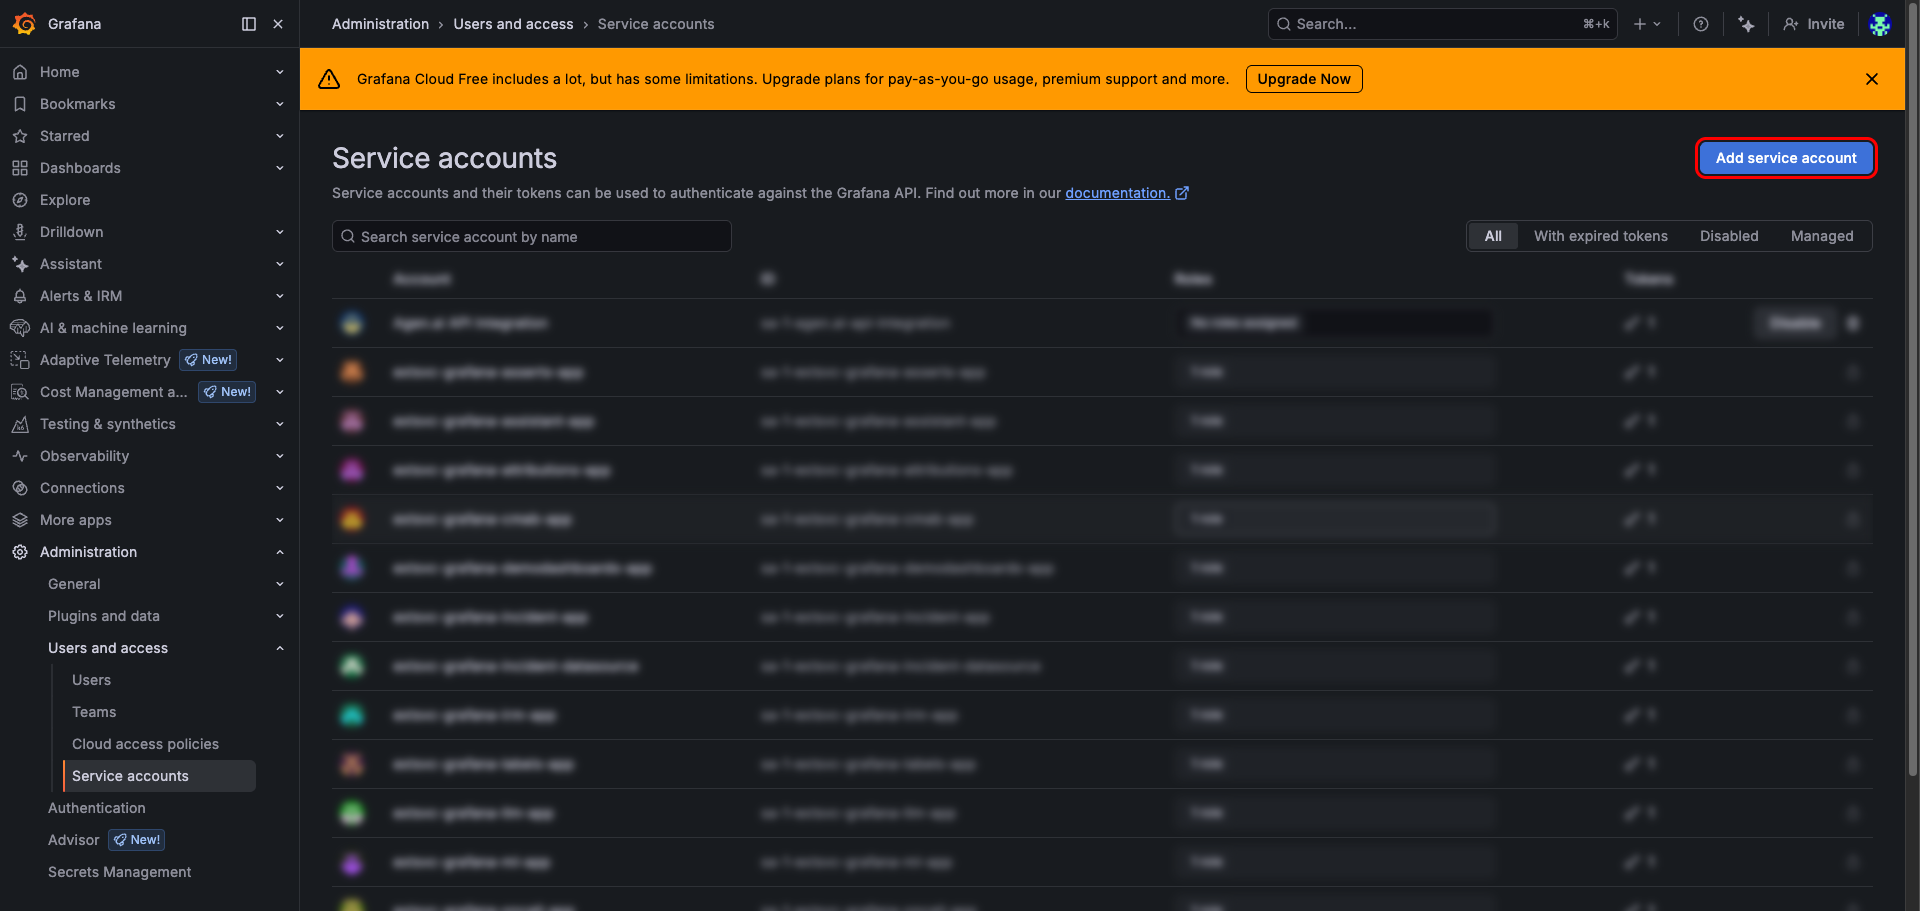
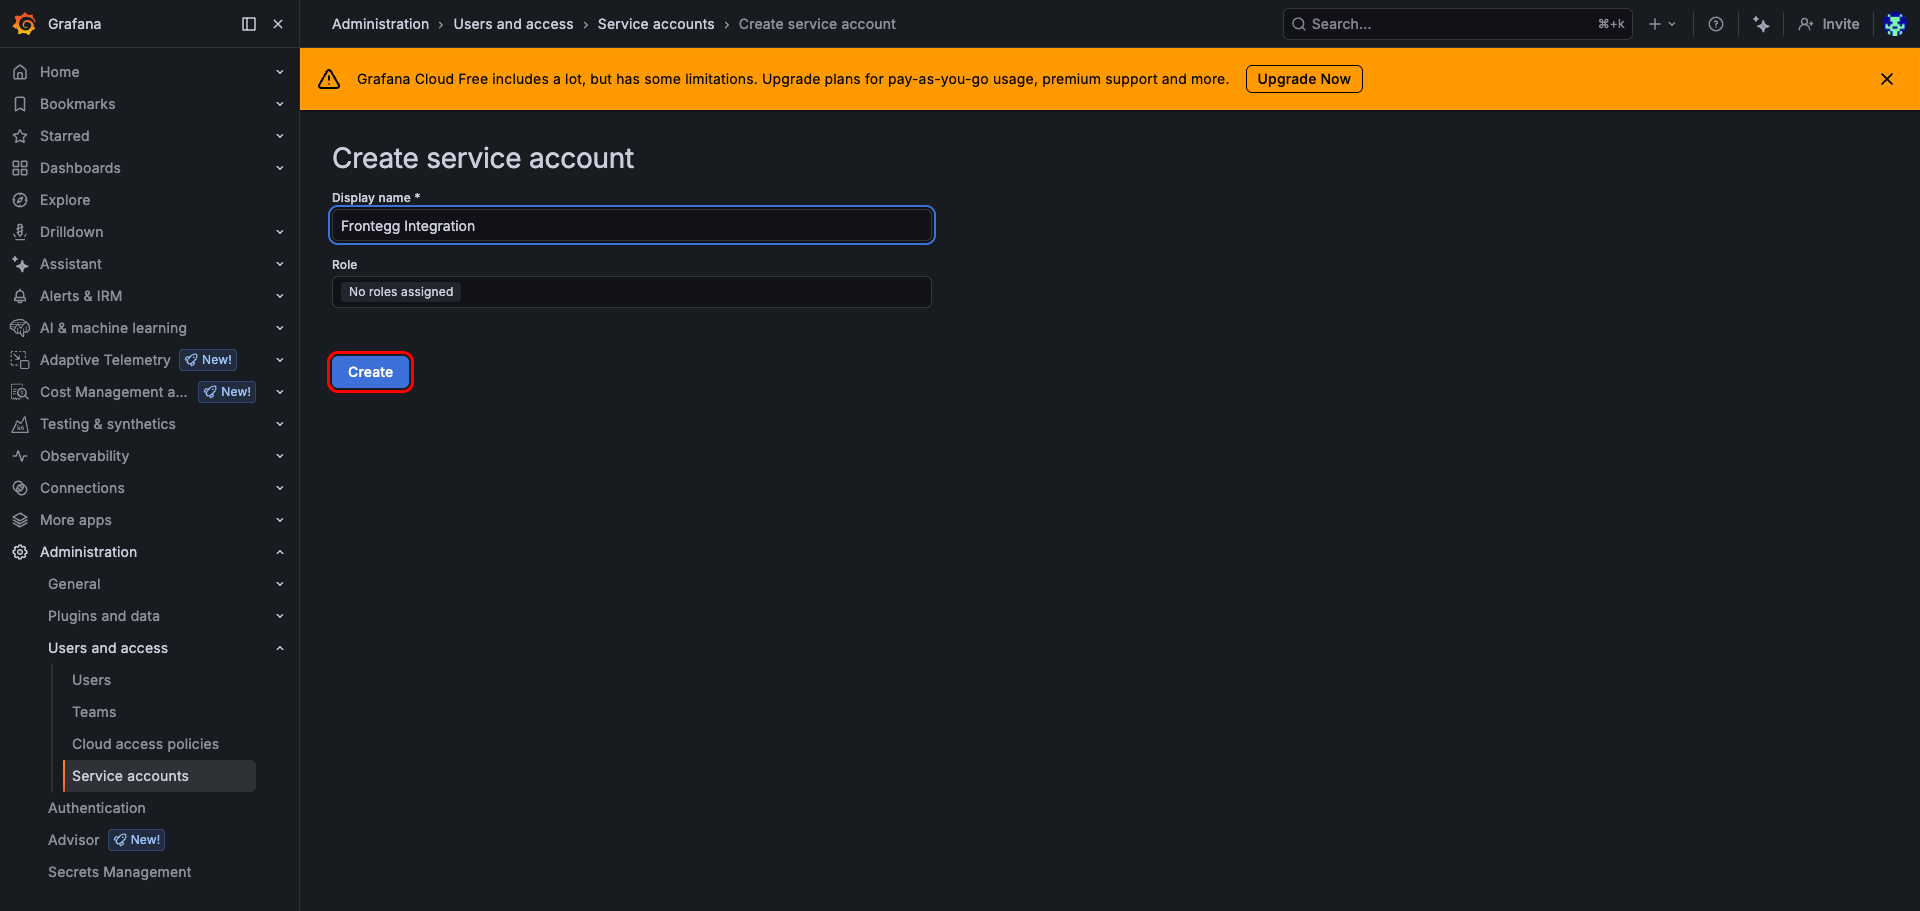
Click Add service account. On the form that appears, enter a descriptive name in the Display name field (for example, Frontegg Integration), then click Create.
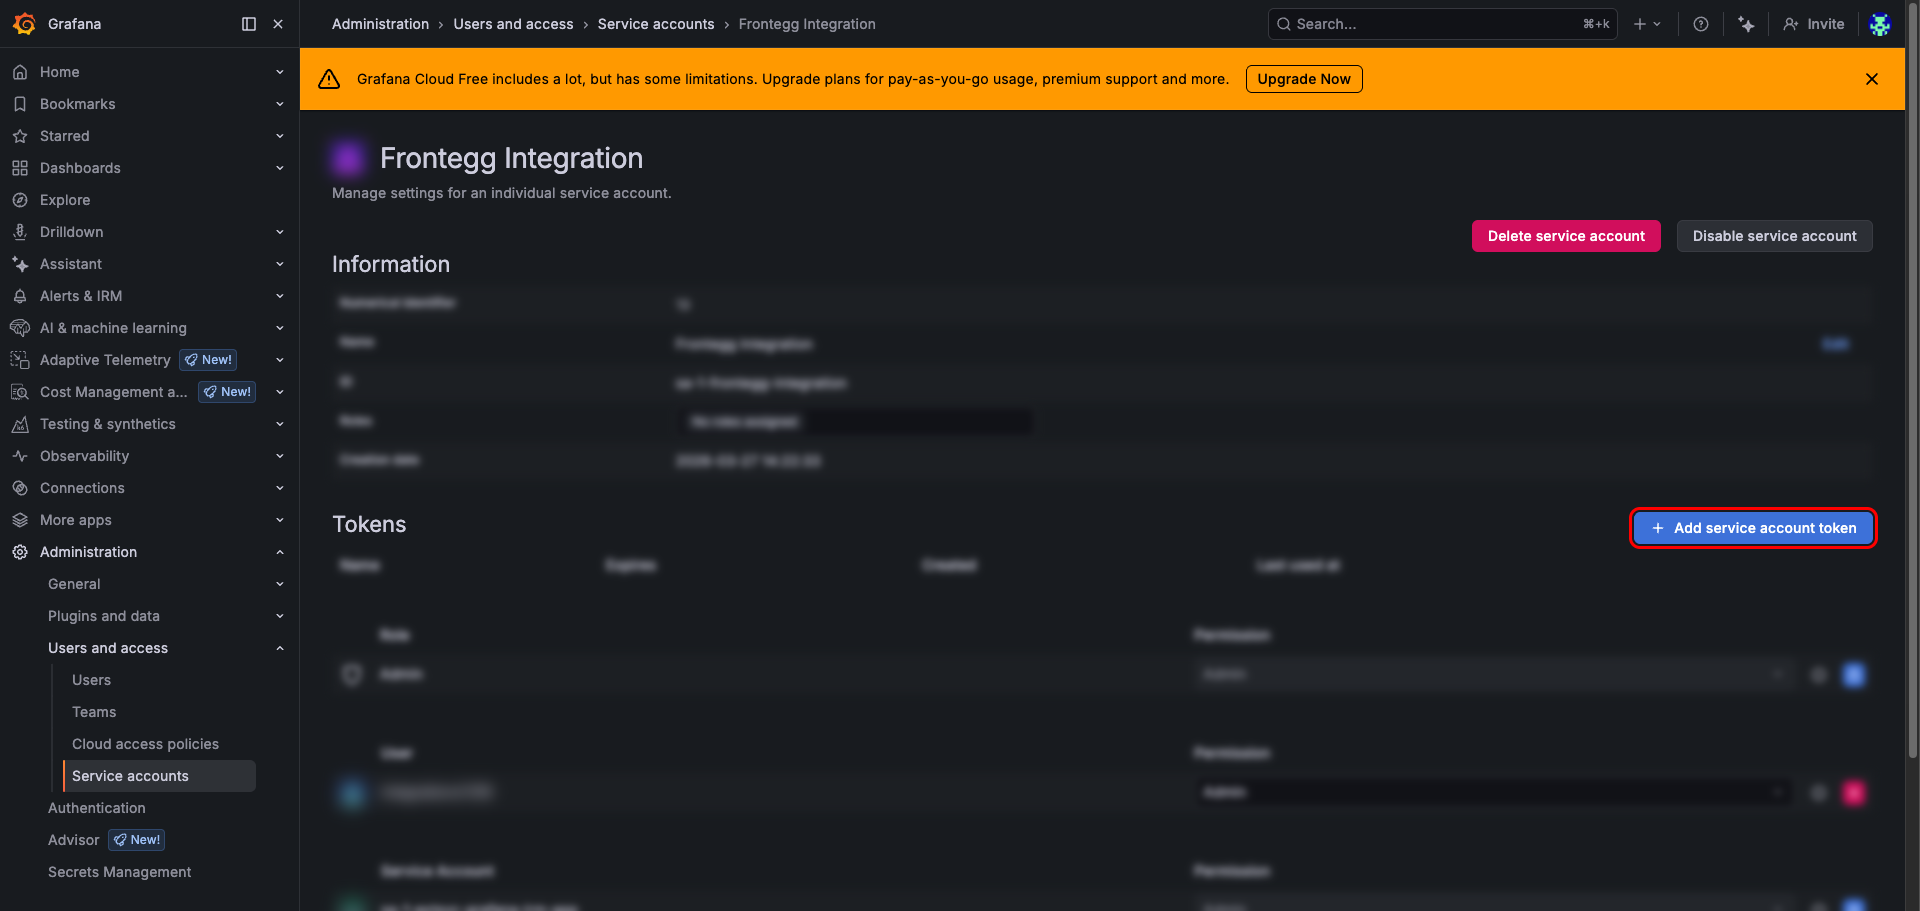
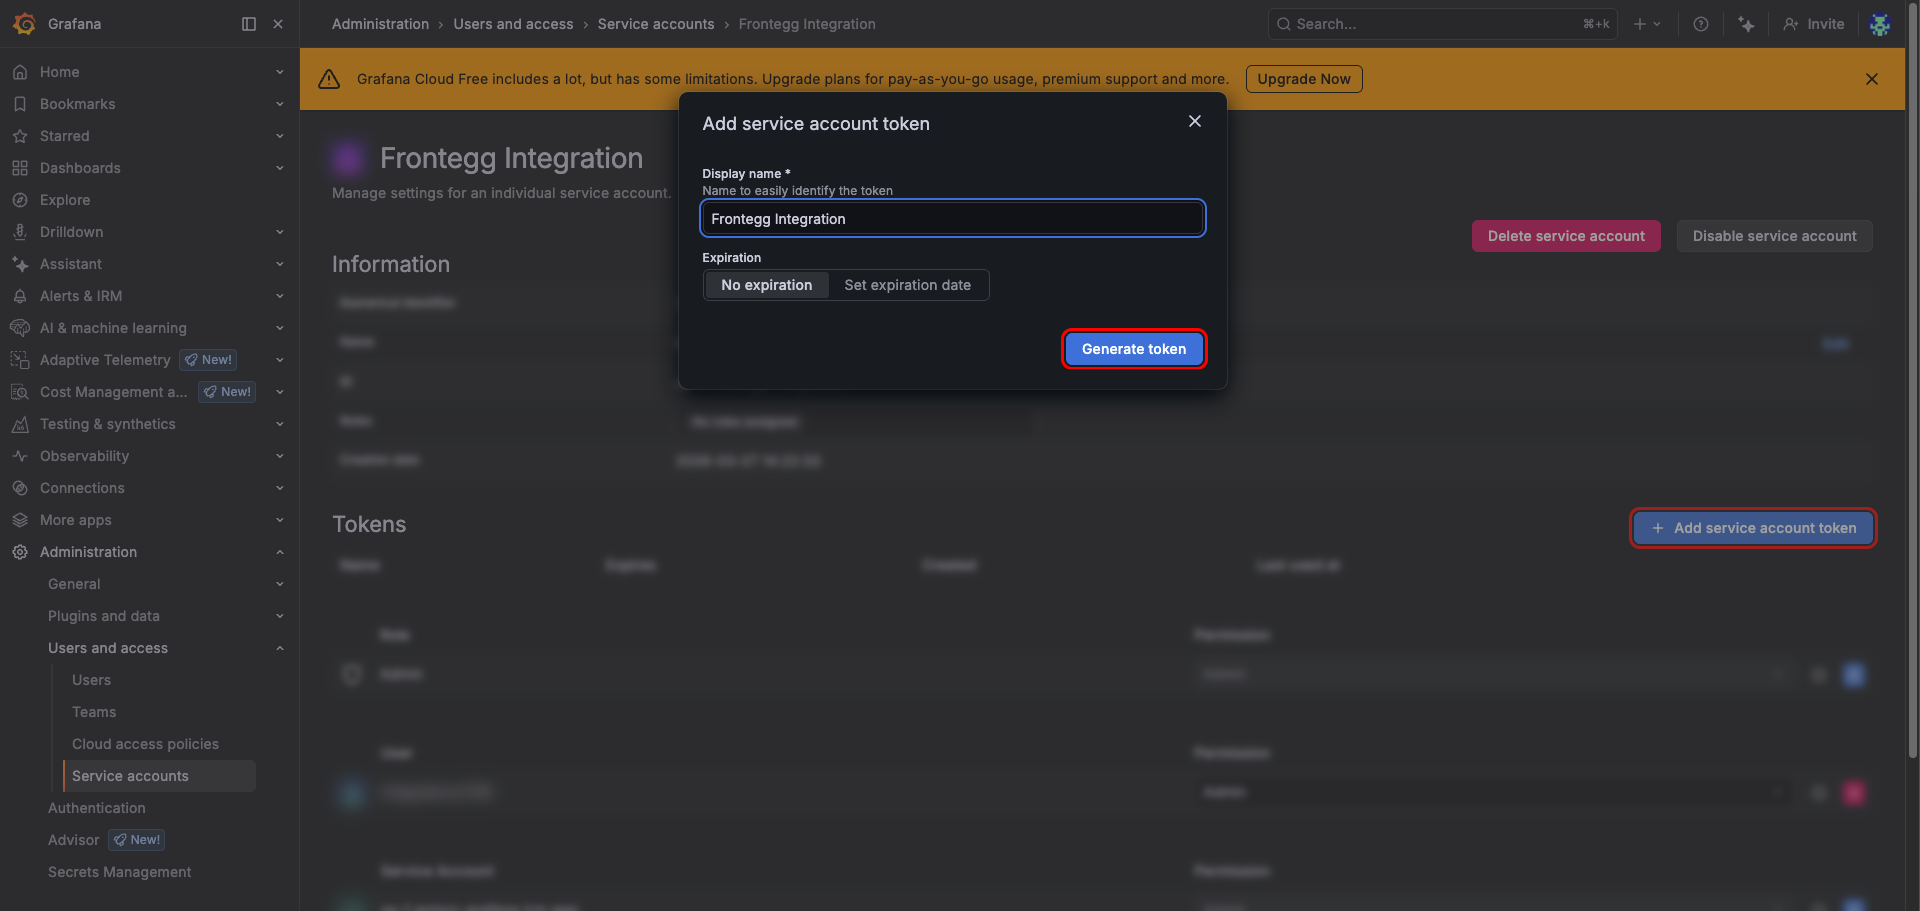
After the service account is created, you are taken to the service account detail page. Click Add service account token to create an API token for this service account.
In the dialog that appears, enter a name for the token (for example, Frontegg Integration) and choose an expiration option. Select No expiration to create a permanent token, or Set expiration date to define a specific validity period. Click Generate token.
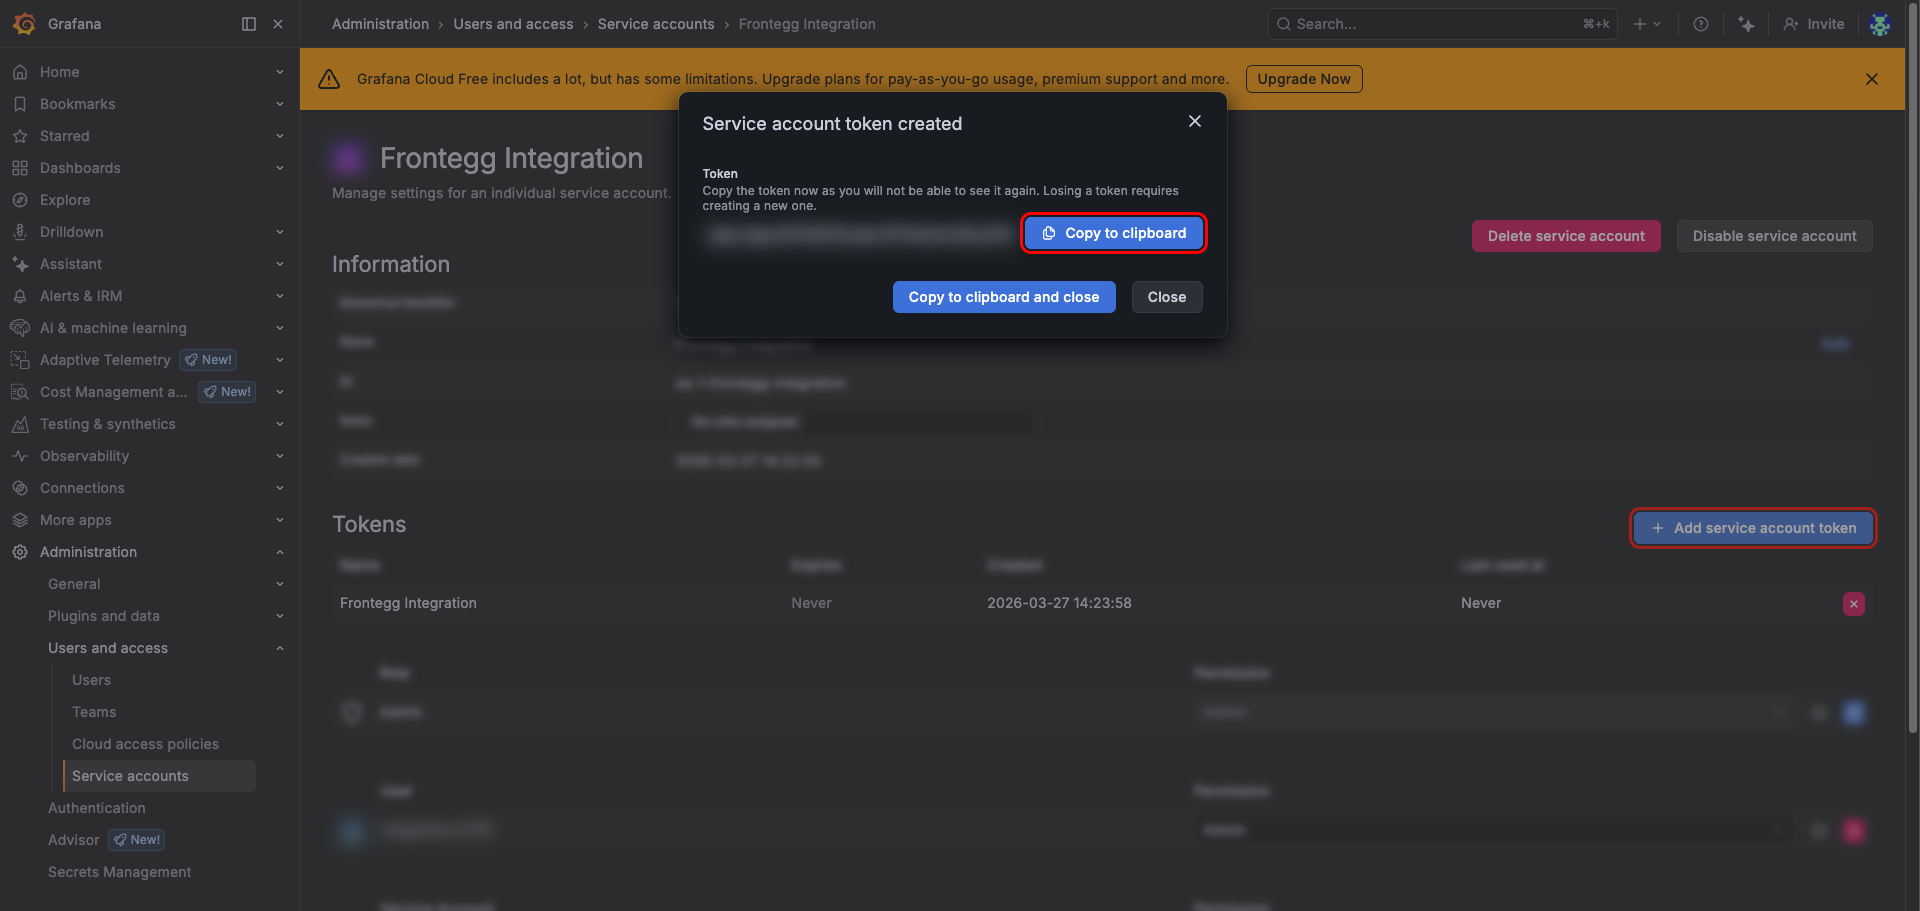
A dialog displays the generated token value. Copy the token and store it in a safe place.
Copy your token now
Copy your token now
This is the only time Grafana will display the token value. If you lose it, you will need to delete the token and create a new one.
Once you have obtained your Grafana service account token from the steps above, enter it in the integration configuration page of the Frontegg portal:
- Open the Frontegg portal and navigate to [ENVIRONMENT] → Integrations → Grafana.
- Enter the service account token in the API Key field.
- Enter your Grafana instance URL in the Grafana instance URL field. Use the root URL of your Grafana stack — for example,
https://mycompany.grafana.netfor Grafana Cloud orhttps://grafana.your-company.comfor a self-hosted instance. Do not include a trailing slash or an/apisuffix. - Click Save.
Keep your token secure
Keep your token secure
Never share or commit your service account token to version control.