Signals
From generic analytics to actionable intelligence: Frontegg's Signals transforms raw data into dynamic insights.
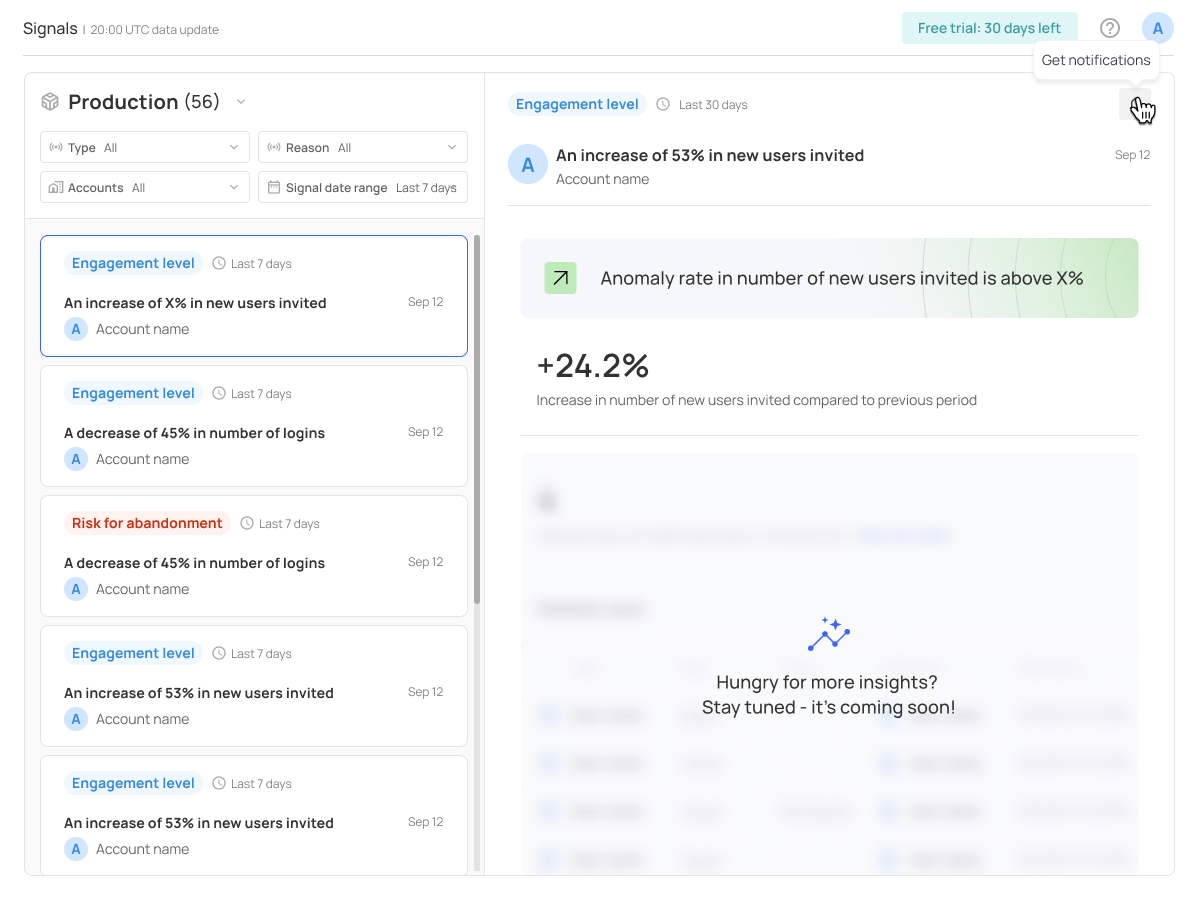
With Frontegg's Signals, you can gain insights into users' and tenants' activities directly through the portal's back office. Frontegg's Signals aggregates and calculates events—such as login counts and the number of deleted users—providing insights into tenant engagement rates and potential abandonment risks. Signals can also be used to create custom webhooks for notifications on specific signals.
Signals dashboard
Your Signals dashboard is located in the left menu of your Frontegg portal. The main dashboard displays various tracked signals, which you can filter by account and date range.
Types of signals
Frontegg calculates signals based on tracked user activity. Abandonment risk is assessed by examining login activity over the past 7 or 30 days and comparing it with the prior corresponding period. For example, user logins from the last 30 days are compared with those of the previous 30 days to determine abandonment risk.

Signals chart
The signals on your dashboard are categorized according to different user actions in your app, indicating trends or behaviors. Refer to the chart below to understand more about each signal. Use the Trigger Event Name to set up a webhook for a specific signal.
Risk for abandonment
| User Behavior (Selected Timeframe) | Trigger Event Name |
|---|---|
| Decrease of over X% in the number of logins and refresh tokens in the last 30 days (compared to the previous period) | Risk for abandonment |
| Decrease of over X% in the number of logins and refresh tokens in the last 7 days (compared to the previous period) | Risk for abandonment |
| Increase of X% in deleted users in the last 30 days (compared to the previous period) | Risk for abandonment |
| Increase of X% in deleted users in the last 7 days (compared to the previous period) | Risk for abandonment |
Engagement level
| User Behavior (Selected Timeframe) | Trigger Event Name |
|---|---|
| Increase of over X% in new users invited in the last 30 days (compared to the previous period) | Engagement level |
| Increase of over X% in new users invited in the last 7 days (compared to the previous period) | Engagement level |
| Top account with the highest number of new users invited in the last 30 days | Engagement level |
Signals and Your Environment
Signals and Your Environment
Your Production environment will offer the most representative view of user activity and is set as the default environment (if enabled for your account). Signals can still be viewed for additional environments through the dropdown menu.
Creating webhooks for signals
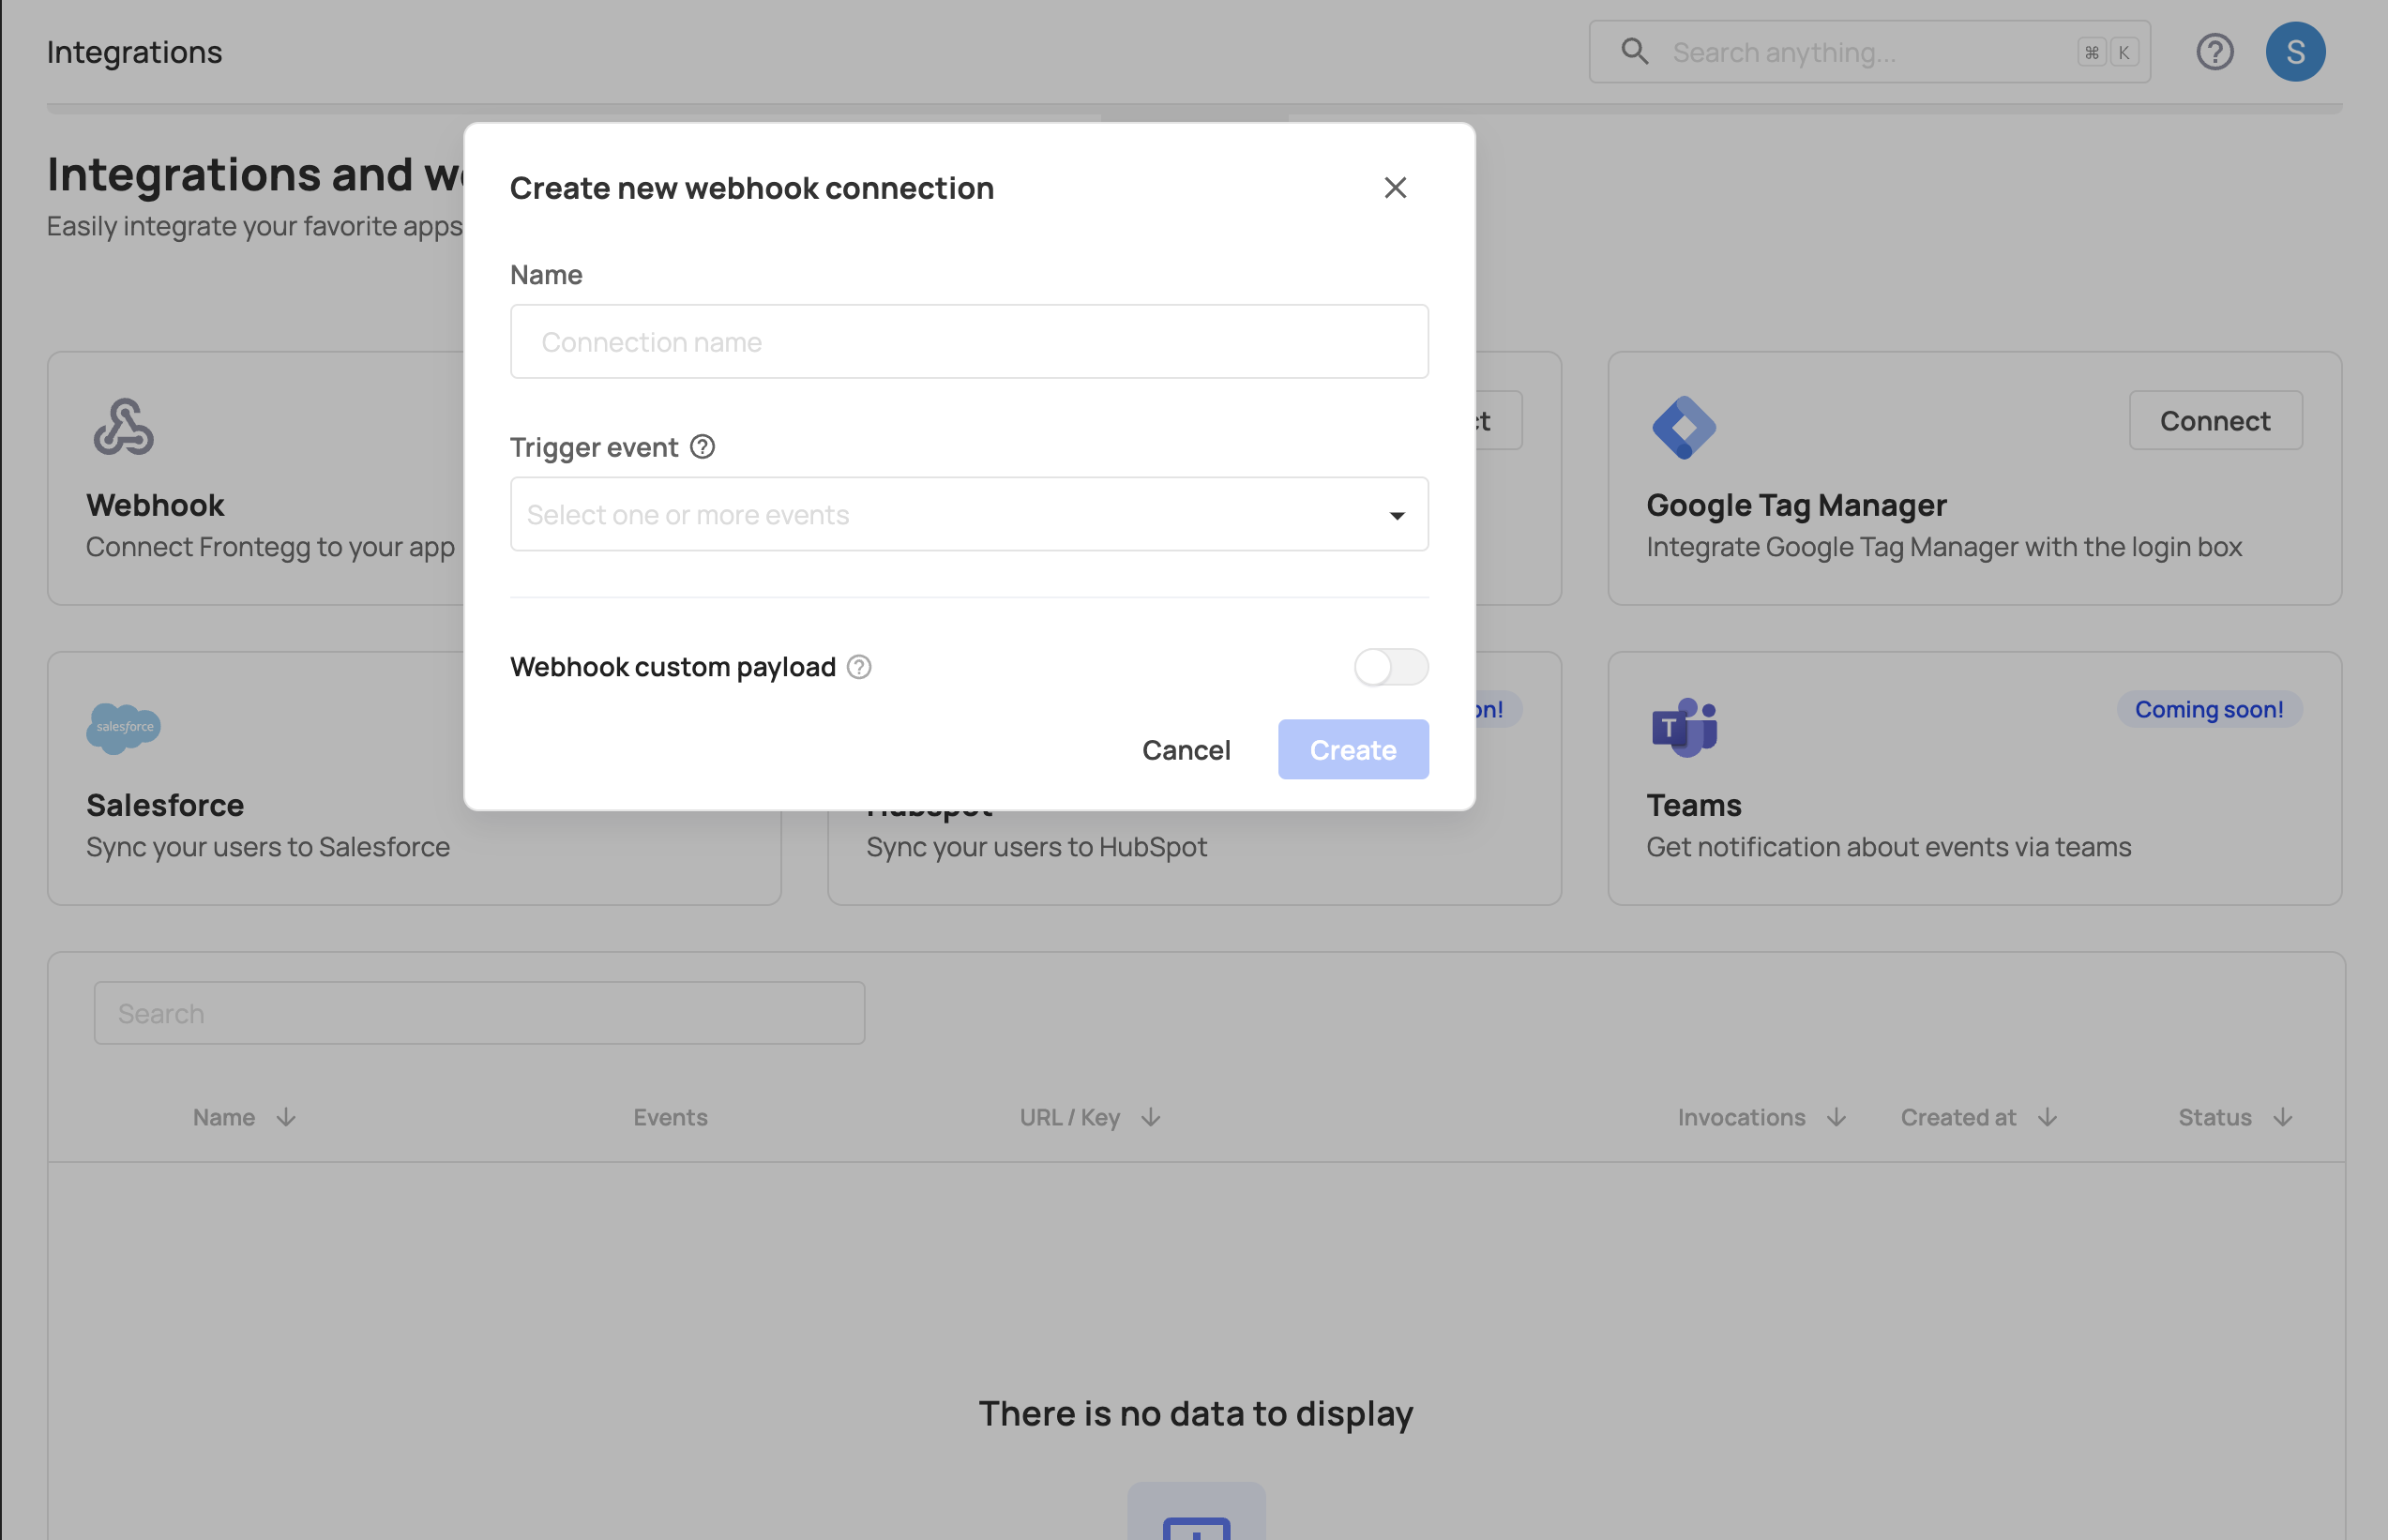
Each signal in your dashboard has a corresponding event name (see the Signals Chart). To create a webhook for a signal, go to "Create new webhook connection" and select the Trigger Event for the webhook. You may also create a designated Slack integration by choosing "Create new Slack connection" and selecting the relevant Trigger Event. Additional third-party integrations will be available soon.

Creating webhooks
Creating webhooks
Learn more about creating webhooks here.