The Logs screen provides a detailed view of every MCP tool execution that passes through your Agen for SaaS gateway. Each log entry captures the full lifecycle of a tool call — from the initial request through authentication, policy evaluation, and response.
The Logs screen displays a searchable, filterable table of events. Each row represents a single MCP interaction.
You can filter logs by:
- Time range — Select a specific date range.
- Tool — Filter by tool name.
- User — Filter by user identity.
- Status — Filter by outcome (success, denied, pending approval).
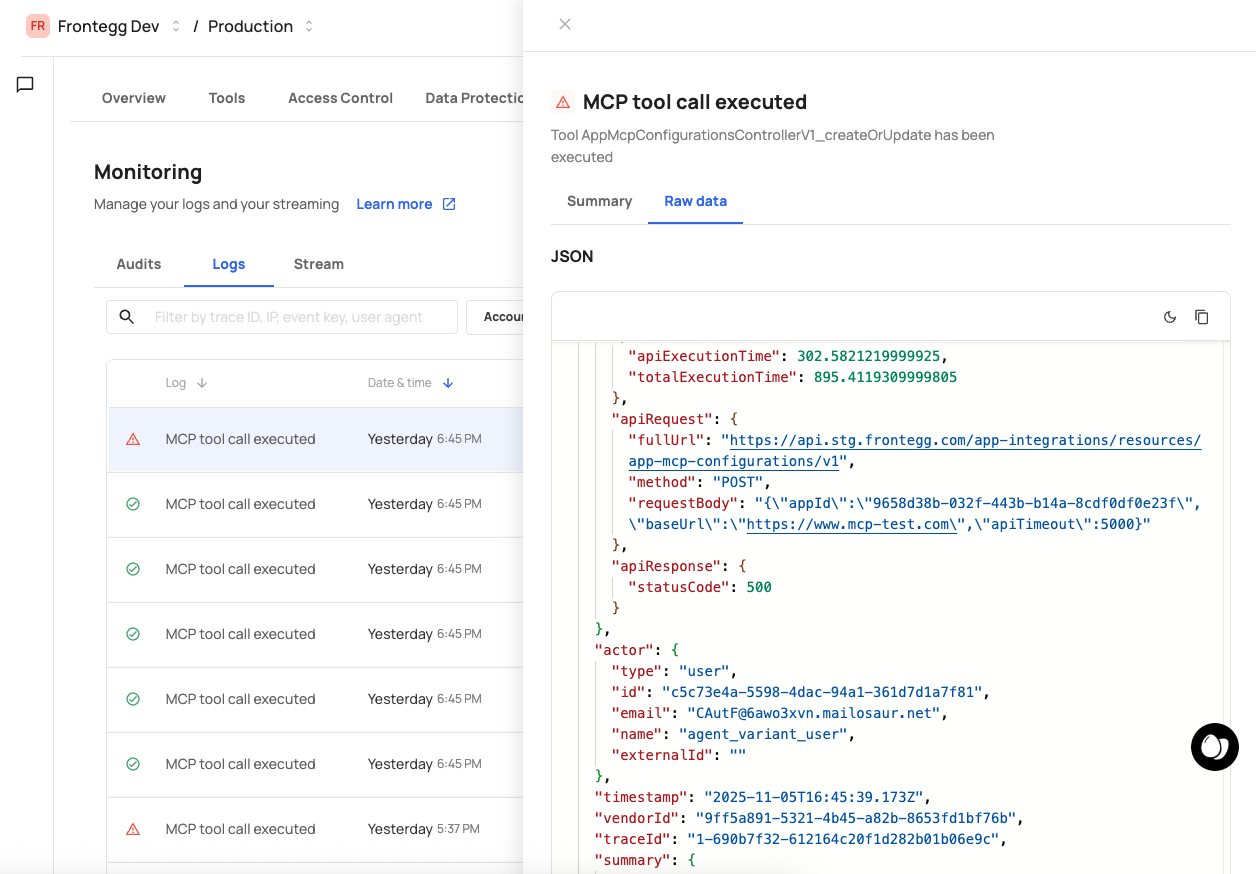
Click any log entry to expand its detail panel. The detail view shows the full structured log in JSON format, including:
{
  "timestamp": "2026-02-03T14:22:31.456Z",
  "tool": "Create_a_new_expense",
  "method": "POST",
  "path": "/api/expenses",
  "user_id": "u-12345",
  "tenant_id": "acme-inc",
  "ai_platform": "ChatGPT",
  "policy_action": "allow",
  "access_control": "passed",
  "data_protection": "applied",
  "response_status": 200,
  "duration_ms": 342
}- Policy denials — Filter by denied status to see which policies blocked tool calls and why.
- Approval bottlenecks — Filter by pending approval status to identify requests waiting for human review.
- Performance issues — Sort by duration to find slow tool calls that may need optimization.
- Access control issues — Look for access control failures to verify that role/permission mappings are correct.