The Dashboard Overview is the central place to understand how your SaaS product is being used through AI platforms and agents.
It provides real-time insights into your MCP server activity, connected AI platforms, and policy enforcement trends — helping you measure adoption, usage, and control effectiveness at a glance.
The dashboard aggregates analytics across all your tenants and MCP tools.
It’s divided into several key sections:
| Section | Description |
|---|---|
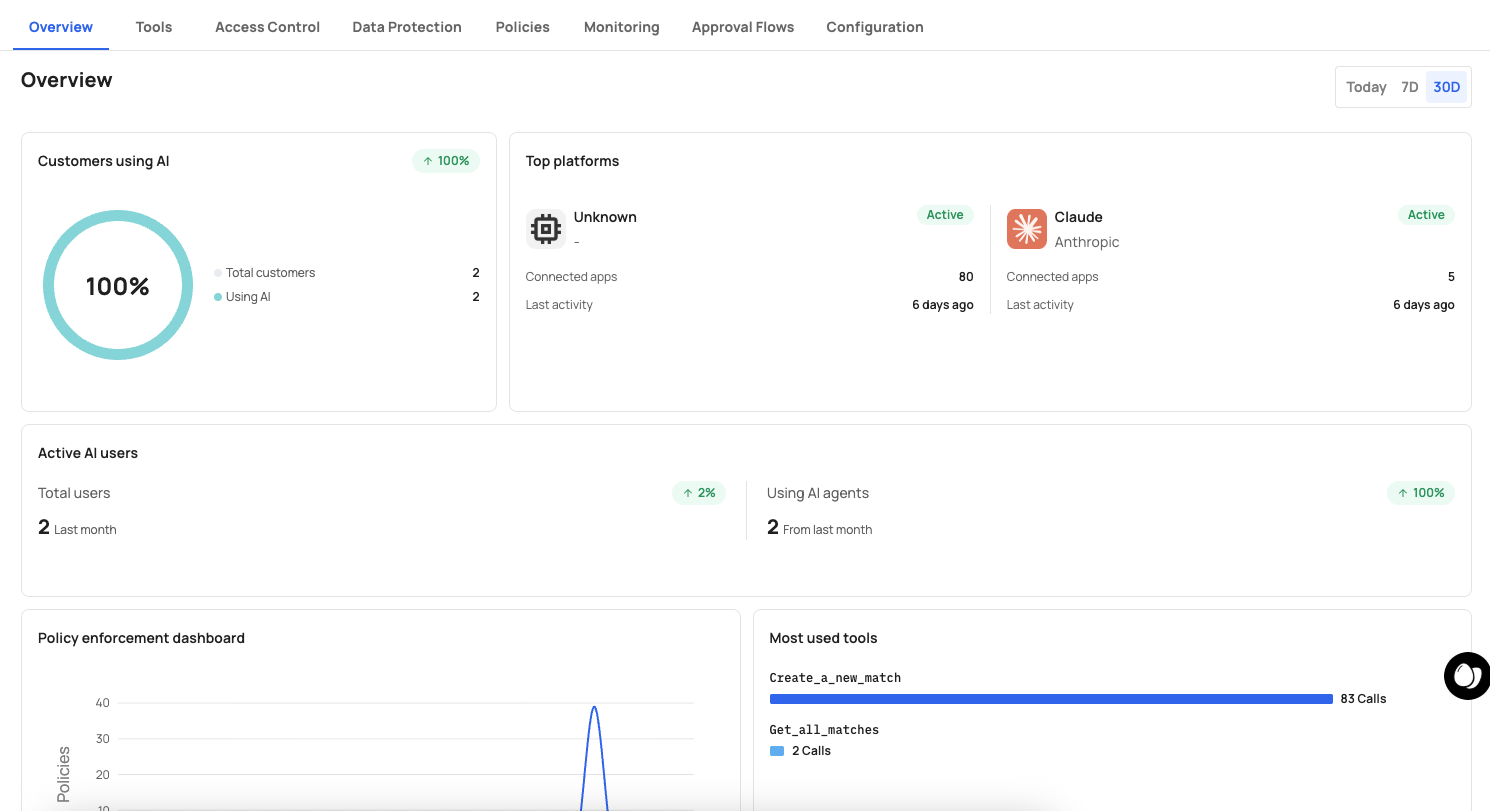
| AI Platform Adoption | Shows which AI platforms (ChatGPT, Claude, Gemini, or custom MCPs) are connected to your MCP server and how often they’re used. |
| Active AI Users | Displays how many users are actively using your product through AI agents over time. |
| Most Used Tools | Highlights the top tools (API endpoints) invoked by AI agents. Great for identifying high-value automations and common use cases. |
| Policy Enforcement Summary | Visual breakdown of how policies were applied — showing counts of Allowed, Denied, Approval Required, and Step-up Auth actions. |
| Recent Activity | Timeline of recent MCP calls, policy triggers, and approval events for quick context. |
This section helps you see where your customers are engaging from.
You can track:
- Which AI platforms (ChatGPT, Claude, Gemini, etc.) your customers use most
- How adoption changes over time
- Which connected platforms drive the most tool activity
Use this data to identify which integrations bring the most engagement and where to invest in enablement or documentation.
This metric shows how many unique users are leveraging AI to interact with your product.
- Track adoption growth week over week
- Identify spikes related to specific campaigns or new tool releases
- Filter by tenant or region to understand usage distribution
This table shows the most frequently executed tools exposed through your MCP server.
- Helps identify the most valuable API capabilities for AI automation
- Surfaces underused tools that might need better descriptions or metadata
- Links directly to each tool for quick editing or disabling
This chart visualizes how your security and governance rules are performing.
You can see the ratio of:
- Allowed — actions that met all conditions
- Denied — requests blocked by a policy
- Approval Required — actions awaiting or recently approved
- Step-up Auth — actions that required extra authentication
Use this to verify that your policies are effective and to quickly detect anomalies (e.g., sudden increases in denials or approvals).
The activity feed provides a chronological record of MCP actions — including tool invocations, approvals, and configuration changes.
This makes it easy to:
- Understand who performed what action and when
- Spot patterns or unusual activity
- Jump directly into detailed logs from the Monitoring screen